The Austin Area residential real estate market changes frequently, just like the weather. 2020-2021 was pandemic pandemonium for the local area housing market. 2022 changed all that. Inventory increases, days on market increases, and home price decreases. Below are some excerpts from an article published last week by my broker, Dan Price. The article takes a broad look at where we are now vs where we were this same time last year. While it's clear that sold prices are down year over year, we're seeing some month over month increases in sold prices which are reducing the year over year loss percentages.
What happens over the next few months is anyone's guess. Some homes continue to have price decreases, others are selling within days, and some with multiple offers...yes they're back! The data suggests that we're still in a sellers market, however, prices may be stabilizing...a good think IMO.
A Comprehensive Look at Austin's Real Estate Market: Recent Trends and Statistics
The Austin housing market has been experiencing significant changes over the past year. With a considerable increase in the number of active listings, fluctuating home prices, and varying trends across different cities and zip codes, it is crucial for potential buyers and sellers to understand the current state of the market.
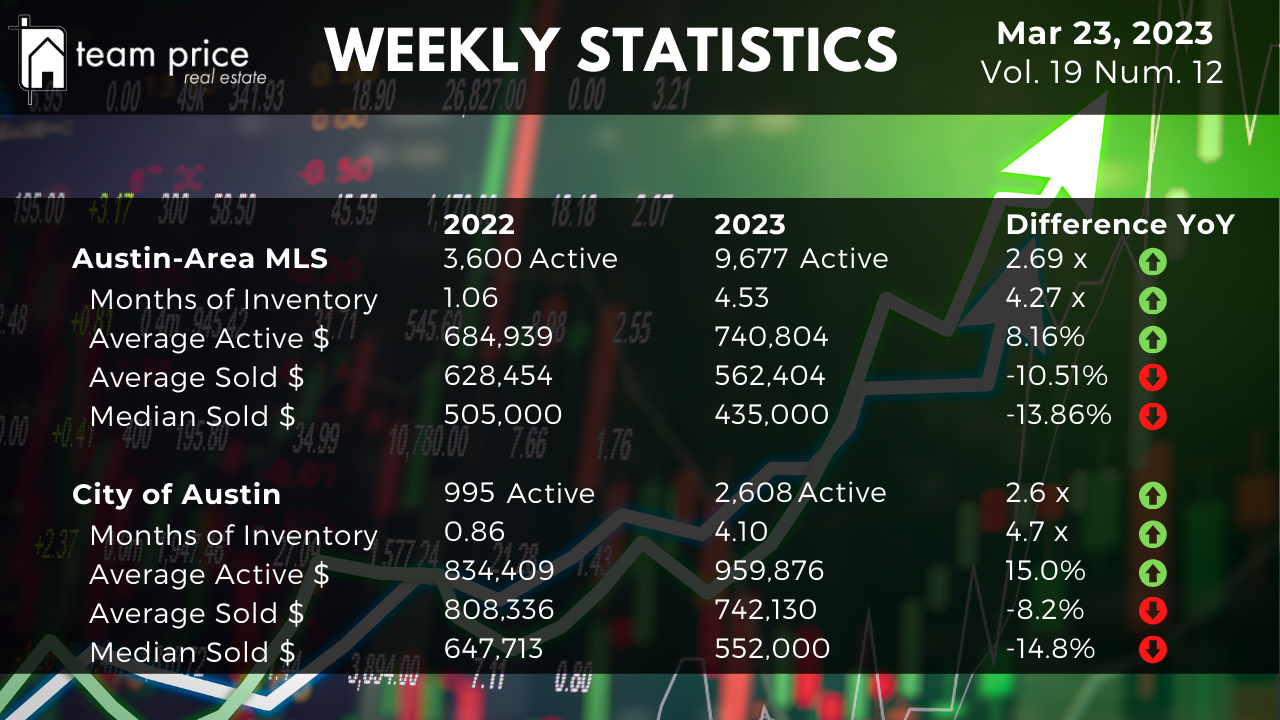
This time last year, the total number of active listings in the Austin-Area MLS was 3,600. Fast forward to today, and that number has skyrocketed to 9,677. The Months of Inventory, an important indicator for the real estate market, has also increased from 1.06 months last year to 4.53 months currently. This represents a staggering 4.27 times increase. In the City of Austin, the inventory increase is even more pronounced at 4.7 times.
Austin home prices have also been impacted. The average list price for active homes in the Austin-Area MLS currently stands at $684,939, up 8.16% year over year. However, the average sold price this month is $562,404, showing a decrease of 10.51% compared to last year. The median sold price is $435,000, a difference of -13.86% year over year.
Within the City of Austin, the median sold price last year was $647,713, while this year it has dropped to $552,000—a significant decline of 14.8% year over year.
The average sold price to list price ratio currently stands at 97.20%.
Analyzing data from the 30 cities in Central Texas, we can observe the following trends: * 13 out of 30 cities (43%) experienced a month-over-month price increase. * 17 out of 30 cities (57%) experienced a month-over-month price decrease. * 4 out of 30 cities (13%) experienced a year-over-year price increase. * 25 out of 30 cities (83%) experienced a year-over-year price decrease.
Year-to-date, eight cities have seen an increase in median price, while 22 have experienced a decrease. From the peak in the past 12 months, 28 cities have seen a decrease in price.
Looking at the 75 zip codes in Central Texas, the trends are as follows: * 41 out of 75 zip codes (55%) experienced a month-over-month price increase. * 32 out of 75 zip codes (43%) experienced a month-over-month price decrease. * 13 out of 75 zip codes (17%) experienced a year-over-year price increase. * 61 out of 75 zip codes (81%) experienced a year-over-year price
Related Articles
Keep reading other bits of knowledge from our team.
Request Info
Have a question about this article or want to learn more?