Austin's metro housing market is undergoing a significant shift and is in full correction mode. With buyer demand having slowed and inventory growing substantially, we are experiencing supply side conditions that are more in favor of buyers than sellers. The slowdown in buyer demand along with an increase in new listings (typical this time of year) is contributing to the surge in active inventory. This also impacts months of available inventory and days on the market, all of which puts pressure on prices especially within the lower price tiers.
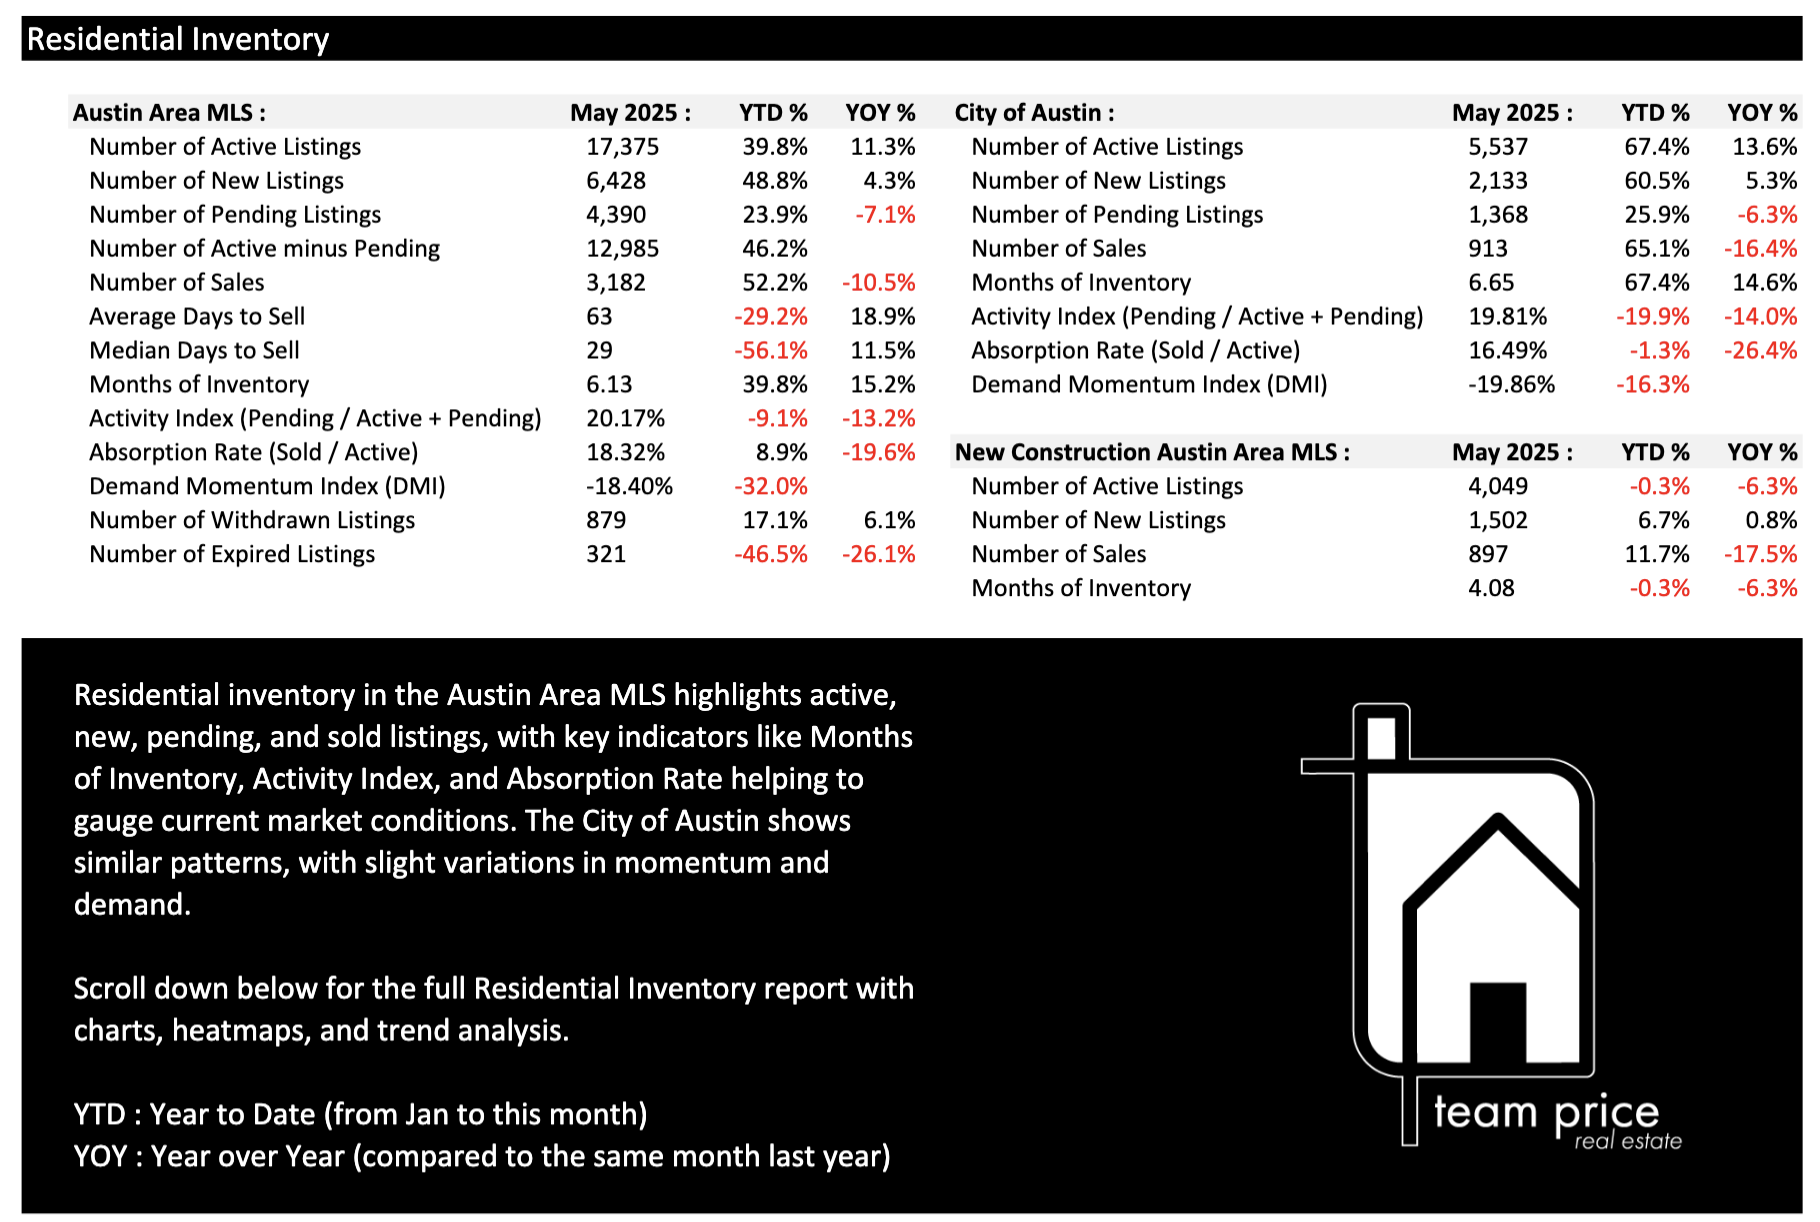
Active inventory in the metro has increased by 11.3% YOY, and 39.8% YTD. (year to date)
Active inventory in the City of Austin has increase 13.6% YOY, and 67.4% YTD
Spring selling season in our local market begins in earnest around the Mid-February - March time frame. The typical peak for sales is April -May. And although prices are experiencing downward pressure, interest rates remain high fluctuating between 6.75 - 7.0%. For many, home ownership is still unaffordable. Current economic conditions and uncertainty are impacting consumer sentiment and dampening buyer demand. Thus, fewer properties are going under contract, as we can see:
Pending Listings down 7.1% (metro), 6.3% (austin), YOY (year over year).
Properties remaining active as new listings come on the market simply add to the total number of properties available. The new listing to pending ratio shows that as well. Currently hovering around 50%, indicates that for every two new listings, only one goes under contract.
Key metrics such as activity index, type of market, months of inventory, and days on market help us to gauge where we are.
Activity Index - the percentage of properties pending out of all those active & pending. This shows what the absorption rate is in a particular city, zip or neighborhood. The current levels for both the metro and City of Austin declined YOY, indicating a decline in absorption of properties available. Further evidence of shrinking buyer demand.
Type of Market: defined by months of inventory: Sellers - less than 4.9 MOI, Neutral - 5-6.9 MOI, Buyers - 7+ MOI
For the 30 cities we track : 23% sellers, 47% neutral, 30% buyers.
Months of inventory - increases when properties are not going under contract. The number indicates how long it would take to sell all available inventory, if no other properties were listed.
Austin metro: @ 6.13 MOI, a 15.2% increase YOY,
City of Austin: @ 6.65 MOI, a 14.6% increase YOY,
Days on Market - DOM; tells us how long it’s taking a property to sell from the time it’s listed on the MLS until the time it goes under contract. We're currently averaging 63 days, an 18.9% increase YOY.
Below is a detailed snapshot of where we are today, these numbers change daily.
In summary: our housing market is quickly approaching a buyers market. Of homes sold in the last 90 days 63.7% have had price reductions. And 55.9 % of active listings are vacant properties
Sellers have come to realize the current state of the market and are adjusting their prices and expectations according. With more available inventory and vacancy rates it's important to price competitively and be prepared to negotiate.
Buyers now have many more choices, time to make their decisions and stronger negotiating power. Despite interest rates, there are valuable opportunities to find well priced homes.